Financial Position
Financial position of the Group
In the period from January to December 2019, the Volkswagen Group generated gross cash flow of €39.9 (35.6) billion. The change in working capital amounted to €−22.0 (−28.3) billion. The administrative fine imposed after regulatory offense proceedings, which was recognized in the reporting period as a special item in connection with the diesel issue, led to an immediate cash outflow. Cash flows from operating activities were up by €10.7 billion to €18.0 billion.
At €20.1 billion, investing activities attributable to operating activities were 3.6% higher in the reporting period than in the previous year.
Cash outflow from financing activities amounted to €−0.9 billion, compared with cash inflow of €24.6 billion in the previous year. Financing activities include the dividend paid to the shareholders of Volkswagen AG, the acquisition of MAN shares tendered as a result of the termination of the control and profit and loss transfer agreement, the cash inflow resulting from the IPO of TRATON and, most particularly, the issuance and redemption of bonds and changes in other financial liabilities. Following the application of the new IFRS 16, payments for the principal portion of the lease liability have to be recognized under financing activities since January 1, 2019.
The Volkswagen Group’s cash and cash equivalents as reported in the cash flow statement were lower than in the prior-year period, at €24.3 (28.1) billion.
At the end of the reporting period, the Volkswagen Group’s net liquidity was €−148.0 billion, compared with €−134.7 billion at the end of 2018.
| (XLS:)
|
CASH FLOW STATEMENT BY DIVISION |
||||||||||||||||||||||||
|---|---|---|---|---|---|---|---|---|---|---|---|---|---|---|---|---|---|---|---|---|---|---|---|---|
|
VOLKSWAGEN GROUP |
AUTOMOTIVE1 |
FINANCIAL SERVICES |
|||||||||||||||||||||
€ million |
2019 |
2018 |
2019 |
2018 |
2019 |
2018 |
||||||||||||||||||
|
|
|
|
|
|
|
||||||||||||||||||
|
||||||||||||||||||||||||
Cash and cash equivalents at beginning of period |
28,113 |
18,038 |
23,354 |
13,428 |
4,759 |
4,609 |
||||||||||||||||||
Earnings before tax |
18,356 |
15,643 |
15,137 |
12,861 |
3,219 |
2,782 |
||||||||||||||||||
Income taxes paid |
−2,914 |
−3,804 |
−2,187 |
−3,786 |
−726 |
−19 |
||||||||||||||||||
Depreciation and amortization expense2 |
24,439 |
22,561 |
15,958 |
15,581 |
8,480 |
6,980 |
||||||||||||||||||
Change in pension provisions |
342 |
524 |
320 |
503 |
23 |
21 |
||||||||||||||||||
Share of the result of equity-accounted investments |
460 |
244 |
520 |
303 |
−59 |
−58 |
||||||||||||||||||
Other noncash income/expense and reclassifications3 |
−734 |
445 |
−651 |
502 |
−83 |
−56 |
||||||||||||||||||
Gross cash flow |
39,950 |
35,613 |
29,097 |
25,964 |
10,853 |
9,650 |
||||||||||||||||||
Change in working capital |
−21,966 |
−28,341 |
1,636 |
−7,433 |
−23,603 |
−20,908 |
||||||||||||||||||
Change in inventories |
−674 |
−5,372 |
−345 |
−5,337 |
−329 |
−34 |
||||||||||||||||||
Change in receivables |
−893 |
−6,400 |
−1,176 |
−1,800 |
283 |
−4,600 |
||||||||||||||||||
Change in liabilities |
2,297 |
3,645 |
1,564 |
2,793 |
733 |
853 |
||||||||||||||||||
Change in other provisions |
1,304 |
−1,286 |
1,400 |
−1,306 |
−96 |
20 |
||||||||||||||||||
Change in lease assets (excluding depreciation) |
−13,204 |
−11,647 |
−110 |
−1,590 |
−13,095 |
−10,056 |
||||||||||||||||||
Change in financial services receivables |
−10,796 |
−7,282 |
303 |
−191 |
−11,099 |
−7,090 |
||||||||||||||||||
Cash flows from operating activities |
17,983 |
7,272 |
30,733 |
18,531 |
−12,750 |
−11,258 |
||||||||||||||||||
Cash flows from investing activities attributable to operating activities |
−20,076 |
−19,386 |
−19,898 |
−18,837 |
−178 |
−549 |
||||||||||||||||||
of which: investments in property, plant and equipment, investment property and intangible assets, excluding capitalized development costs |
−14,230 |
−13,729 |
−14,007 |
−13,218 |
−223 |
−510 |
||||||||||||||||||
capitalized development costs |
−5,171 |
−5,234 |
−5,171 |
−5,234 |
– |
– |
||||||||||||||||||
acquisition and disposal of equity investments |
−913 |
−705 |
−716 |
−594 |
−196 |
−111 |
||||||||||||||||||
Net cash flow4 |
−2,093 |
−12,113 |
10,835 |
−306 |
−12,928 |
−11,807 |
||||||||||||||||||
Change in investments in securities, loans and time deposits |
−1,069 |
−2,204 |
−5,018 |
6,129 |
3,949 |
−8,332 |
||||||||||||||||||
Cash flows from investing activities |
−21,146 |
−21,590 |
−24,916 |
−12,708 |
3,771 |
−8,882 |
||||||||||||||||||
Cash flows from financing activities |
−865 |
24,566 |
−11,278 |
4,274 |
10,413 |
20,292 |
||||||||||||||||||
of which: Capital transactions with noncontrolling interests |
1,368 |
−28 |
1,368 |
−28 |
– |
– |
||||||||||||||||||
Capital contributions/capital redemptions |
– |
1,491 |
−970 |
1,418 |
970 |
73 |
||||||||||||||||||
MAN noncontrolling interest shareholders: compensation payments and acquisition of shares tendered |
−1,109 |
−2,117 |
−1,109 |
−2,117 |
– |
– |
||||||||||||||||||
Effect of exchange rate changes on cash and cash equivalents |
243 |
−173 |
205 |
−171 |
38 |
−2 |
||||||||||||||||||
Change of loss allowance within cash & cash equivalents |
1 |
−1 |
1 |
−1 |
−0 |
0 |
||||||||||||||||||
Net change in cash and cash equivalents |
−3,784 |
10,075 |
−5,256 |
9,925 |
1,472 |
150 |
||||||||||||||||||
|
|
|
|
|
|
|
||||||||||||||||||
Cash and cash equivalents at Dec. 315 |
24,329 |
28,113 |
18,098 |
23,354 |
6,231 |
4,759 |
||||||||||||||||||
Securities, loans and time deposits |
29,099 |
28,036 |
13,458 |
8,697 |
15,641 |
19,339 |
||||||||||||||||||
Gross liquidity |
53,428 |
56,148 |
31,556 |
32,051 |
21,872 |
24,098 |
||||||||||||||||||
Total third-party borrowings |
−201,468 |
−190,883 |
−10,280 |
−12,683 |
−191,189 |
−178,200 |
||||||||||||||||||
Net liquidity6 |
−148,040 |
−134,735 |
21,276 |
19,368 |
−169,316 |
−154,103 |
||||||||||||||||||
AUTOMOTIVE DIVISION NET CASH FLOW 2019
€ billion
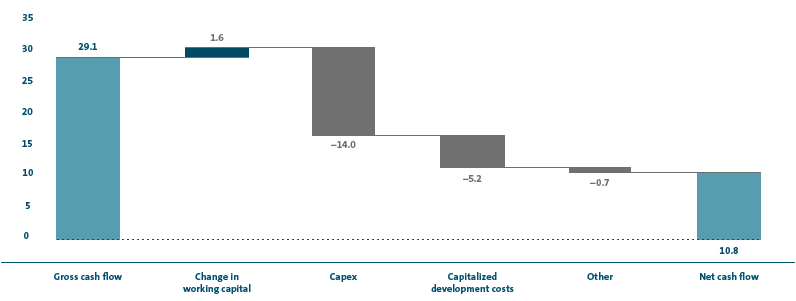
Financial position of the Automotive Division
The Automotive Division’s gross cash flow was €29.1 billion in fiscal year 2019, an increase of €3.1 billion compared with the prior-year figure. This was driven particularly by healthy earnings growth, lower tax payments than in the previous year, and positive effects from the application of the new IFRS 16. The change in working capital amounted to €+1.6 (−7.4) billion. Year-on-year, above all a significantly smaller increase in inventories and markedly lower cash outflows attributable to the diesel issue had a positive effect. As a result, cash flows from operating activities rose by €12.2 billion to €30.7 billion.
Investing activities attributable to operating activities amounted to €19.9 billion, €1.1 billion up on the prior-year period. Investments in property, plant and equipment, investment property and intangible assets, excluding capitalized development costs (capex) included in this figure stood at €14.0 billion, an increase of 6.0% compared with 2018. The ratio of capex to sales revenue was unchanged at 6.6 (6.6)%. Capex was primarily allocated to our production facilities and to models that we launched in the reporting period or are planning to launch next year. These are primarily vehicles in the Golf, Atlas, ID.3, ID.4, Audi A3, Audi e-tron, Audi Q3, Audi A6/A7 family and Porsche Taycan model series as well as the Bentley Continental series. Other investment priorities included the ecological focus of our model range, product electrification and digitalization, and our modular toolkits. Additions to capitalized development costs amounting to €5.2 (5.2) billion were on a level with the 2018 figure. Strategic investments in a number of companies led to a €0.1 billion increase in the “Acquisition and disposal of equity investments” item to €0.7 billion.
Compared with the low prior-year figure, the Automotive Division’s net cash flow improved markedly by €11.1 billion to €10.8 billion. The main reasons were the increase in profit, a decline in cash outflows attributable to the diesel issue and a smaller increase in inventories.
The cash outflow from financing activities amounted to €−11.3 billion in fiscal year 2019; in the previous year, there had been a cash inflow of €4.3 billion. The dividend paid to the shareholders of Volkswagen AG in May 2019 amounted to €2.4 billion, a rise of €0.5 billion compared with the previous year. The “Capital transactions with noncontrolling interests” item includes the cash inflow of €1.4 billion resulting from the IPO of TRATON. As a result of the termination of the control and profit and loss transfer agreement with MAN SE, financing activities also include the acquisition of MAN shares tendered, and most particularly, the issuance and redemption of bonds and changes in other financial liabilities. As from January 1, 2019, payments of the principal portion of the lease liability are also reported in this item, as required following the application of the new IFRS 16.
As a result of the recognition of lease liabilities as financial liabilities required under IFRS 16, third-party borrowings in the Automotive Division were €5.4 billion higher at the end of the reporting period than at the end of the previous fiscal year. Despite this non-cash effect, the Automotive Division’s net liquidity was €21.3 billion on December 31, 2019, €1.9 billion above the level at the end of fiscal year 2018. The Automotive Division’s net liquidity accounted for 8.4 (8.2)% of consolidated sales revenue in the reporting period.
| (XLS:)
|
FINANCIAL POSITION IN THE PASSENGER CARS BUSINESS AREA1 |
||||||
|---|---|---|---|---|---|---|
€ million |
2019 |
2018 |
||||
|
||||||
|
|
|
||||
Gross cash flow |
25,474 |
22,910 |
||||
Change in working capital |
3,053 |
−5,916 |
||||
Cash flows from operating activities |
28,528 |
16,995 |
||||
Cash flows from investing activities attributable to operating activities |
−20,254 |
−17,303 |
||||
Net cash flow |
8,273 |
−308 |
||||
In fiscal year 2019, the Passenger Cars Business Area’s gross cash flow was €25.5 billion, up €2.6 billion on the previous year due to earnings-related factors, lower tax payments and positive effects of the application of the new IFRS 16. The change in working capital amounted to €3.1 (−5.9) billion. The smaller increase in inventories than in the previous year and lower cash outflows attributable to the diesel issue had a positive effect. Consequently, cash flows from operating activities went up by €11.5 billion to €28.5 billion. Investing activities attributable to operating activities in the Passenger Cars Business Area increased to €20.3 (17.3) billion. Capex was higher, while capitalized development costs declined slightly. The intragroup sale of the power engineering business by the Commercial Vehicles Business Area to the Passenger Cars Business Area and strategic investments in a number of companies led to a marked year-on-year increase in the “Acquisition and disposal of equity investments” item. Compared with the low prior-year figure, the Passenger Cars Business Area’s net cash flow improved by €8.6 billion to €8.3 billion.
| (XLS:)
|
FINANCIAL POSITION IN THE COMMERCIAL VEHICLES BUSINESS AREA1 |
||||||
|---|---|---|---|---|---|---|
€ million |
2019 |
2018 |
||||
|
||||||
|
|
|
||||
Gross cash flow |
3,357 |
2,745 |
||||
Change in working capital |
−1,249 |
−1,257 |
||||
Cash flows from operating activities |
2,108 |
1,488 |
||||
Cash flows from investing activities attributable to operating activities |
603 |
−1,372 |
||||
Net cash flow |
2,711 |
116 |
||||
In the reporting period, the Commercial Vehicles Business Area’s gross cash flow improved by €0.6 billion to €3.4 billion. The slight year-on-year increase was driven particularly by higher profits. The change in working capital amounted to €−1.2 (−1.3) billion. Cash flows from operating activities were up by €0.6 billion to €2.1 billion. The intragroup sale of the power engineering business led to a cash inflow from investing activities attributable to operating activities. Net cash flow increased to €2.7 (0.1) billion.
| (XLS:)
|
FINANCIAL POSITION IN THE POWER ENGINEERING BUSINESS AREA |
||||
|---|---|---|---|---|
€ million |
2019 |
2018 |
||
|
|
|
||
Gross cash flow |
265 |
309 |
||
Change in working capital |
−168 |
−260 |
||
Cash flows from operating activities |
98 |
49 |
||
Cash flows from investing activities attributable to operating activities |
−247 |
−162 |
||
Net cash flow |
−150 |
−113 |
||
In fiscal year 2019, the Power Engineering Business Area recorded gross cash flow of €0.3 (0.3) billion. Due to a decrease in funds tied up in working capital, the change in working capital amounted to €−0.2 (−0.3) billion. Cash flows from operating activities were higher than in the previous year. Investing activities attributable to operating activities increased by €0.1 billion to €0.2 billion. At €−0.1 (−0.1) billion, net cash flow was virtually on a level with the previous year.
Financial position in the Financial Services Division
In the reporting period, the Financial Services Division’s gross cash flow was €10.9 (9.6) billion. The change in working capital of €−23.6 (−20.9) billion was a result of an increase in funds tied up in working capital, mainly driven by the growth in business volume. Cash flows from operating activities amounted to €−12.7 (−11.3) billion.
Investing activities attributable to operating activities declined by €0.4 billion to €0.2 billion in the reporting period, mainly due to lower capex.
In the Financial Services Division, financing activities resulted in a cash inflow of €10.4 (20.3) billion in fiscal year 2019 for refinancing the business volume. This figure primarily included the issuance and redemption of bonds and other financial liabilities.
At the end of the reporting period, the Financial Services Division’s negative net liquidity, which is common in the industry, stood at €−169.3 billion; on December 31, 2018, it had amounted to €−154.1 billion.