Net Assets
Consolidated balance sheet structure
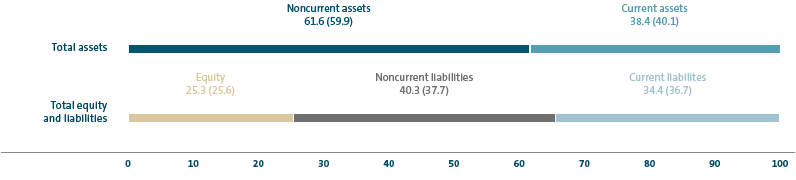
At the end of the reporting period, the Volkswagen Group recorded total assets of €488.1 billion, 6.5% more than on December 31, 2018. This increase was mainly the result of the higher business volume in the Financial Services Division, the application of the new IFRS 16 and currency translation effects. The structure of the consolidated balance sheet as on the reporting date is shown in the chart on this page. The Volkswagen Group’s equity amounted to €123.7 billion, €6.3 billion more than at the previous balance sheet date. The equity ratio was 25.3 (25.6)%. The “Assets held for sale” item mainly comprises the asset carrying amounts expected to be derecognized following the disposal of the interest in Renk, which was resolved in January 2020. The item also includes the carrying amount of the shares in Autonomous Intelligent Driving, which is to be used as a contribution to the equity investment in the joint venture with Ford, in addition to the provision of financial resources. The “Liabilities held for sale” item comprises the carrying amounts of the respective liabilities expected to be derecognized.
As of the end of fiscal year 2019, the Group had off-balance-sheet commitments in the form of contingent liabilities in the amount of €8.5 (9.3) billion, financial guarantees in the amount of €0.4 (0.3) billion and other financial obligations in the amount of €19.4 (26.6) billion. The previous year’s amount of other financial obligations includes obligations from long-term leasing and rental contracts, which IFRS 16 requires to be presented in the affected balance sheet items as from January 1, 2019. Contingent liabilities relate primarily to legal risks in connection with the diesel issue as well as potential liabilities from tax risks in the Commercial Vehicles Business Area in Brazil. Other financial obligations primarily result from purchase commitments for property, plant and equipment and irrevocable credit commitments to customers. In addition, they include investments to which the Group has committed itself in the infrastructure for zero-emission vehicles and in initiatives to promote access to and awareness of this technology. These commitments were made as part of the settlement agreements in the USA in connection with the diesel issue. Other financial obligations include an amount of €1.2 billion for this purpose.
CONSOLIDATED BALANCE SHEET STRUCTURE 2019
in percent
Automotive Division balance sheet structure
At the end of the reporting period, intangible assets were up slightly on the 2018 fiscal year. The marked increase in property, plant and equipment in the Automotive Division was attributable to the new IFRS 16. The high volume of investments was another factor driving this growth. Shares accounted for using the equity method were down on the prior-year figure: the business results of the Chinese joint ventures, which were at the prior-year level were offset by higher dividend resolutions. Noncurrent assets totaled €153.7 (143.2) billion, thus exceeding the figure at the previous balance sheet date.
Current assets rose to €93.1 (91.4) billion compared with the end of 2018. Current other receivables and financial assets increased. The Automotive Division’s cash and cash equivalents were €4.5 billion lower, at €19.7 billion.
At the end of 2019, the Automotive Division’s equity was €92.8 billion, 4.4% higher than on December 31, 2018. The good earnings development increased equity. Noncontrolling interests were up by €1.2 billion due to the issuance of TRATON SE shares. As a result of the termination of the control and profit and loss transfer agreement with MAN SE, the amount of €0.7 billion remaining from the put options and compensation rights in MAN SE granted to noncontrolling interest shareholders was reclassified directly to equity; €0.3 billion of this amount led to an increase in noncontrolling interests. The noncontrolling interests are now primarily held by the noncontrolling interest shareholders of TRATON, Renk and Audi. Currency translation effects additionally had a positive effect. Higher actuarial losses from the remeasurement of pension plans, the dividend paid to the shareholders of Volkswagen AG and negative effects from the measurement of derivatives recognized directly in equity had a decreasing effect on the Automotive Division’s equity. The fact that total assets rose due to, among other factors, the implementation of the new IFRS 16 led to a slight decline in the equity ratio to 37.6 (37.9)%, despite an increase in equity.
At €90.8 (77.7) billion, noncurrent liabilities were markedly higher than a year earlier. The noncurrent financial liabilities included in this item rose, mainly as a result of the application of the new IFRS 16. Pension provisions were up significantly on the 2018 balance sheet date, mainly because of the actuarial remeasurement following a change in the discount rate. Noncurrent other liabilities were higher, driven by effects arising from the measurement of derivatives.
Current liabilities declined to €63.2 billion, down 7.0% compared with the end of 2018. As a result of the extraordinary termination of the control and profit and loss transfer agreement with MAN SE, the “Put options and compensation rights granted to noncontrolling interest shareholders” item was settled: the tendered MAN shares were acquired, the cash compensation was paid and the remaining amount was reclassified directly to equity. Current financial liabilities stood at €−7.3 (−1.5) billion. The figures for the Automotive Division also contain the elimination of intragroup transactions between the Automotive and Financial Services divisions. As the current financial liabilities for the primary Automotive Division were lower than the loans granted to the Financial Services Division, a negative amount was disclosed in both periods. Trade liabilities decreased. Current other liabilities were higher, primarily due to the effects from the measurement of derivatives and was attributable to higher liabilities from buyback transactions.
On December 31, 2019, the Automotive Division’s total assets amounted to €246.8 billion, up 5.2% compared with the end of 2018.
| (XLS:)
|
CONSOLIDATED BALANCE SHEET BY DIVISION AS OF DECEMBER 31 |
||||||||||||||
|---|---|---|---|---|---|---|---|---|---|---|---|---|---|---|
|
VOLKSWAGEN GROUP |
AUTOMOTIVE1 |
FINANCIAL SERVICES |
|||||||||||
€ million |
2019 |
2018 |
2019 |
2018 |
2019 |
2018 |
||||||||
|
||||||||||||||
|
|
|
|
|
|
|
||||||||
Assets |
|
|
|
|
|
|
||||||||
Noncurrent assets |
300,608 |
274,620 |
153,736 |
143,153 |
146,873 |
131,467 |
||||||||
Intangible assets |
66,214 |
64,613 |
66,010 |
64,404 |
204 |
209 |
||||||||
Property, plant and equipment |
66,152 |
57,630 |
65,043 |
54,619 |
1,110 |
3,010 |
||||||||
Lease assets |
48,938 |
43,545 |
2,084 |
5,297 |
46,853 |
38,249 |
||||||||
Financial services receivables |
86,973 |
78,692 |
−390 |
9 |
87,363 |
78,684 |
||||||||
Investments, equity-accounted investments and other equity investments, other receivables and financial assets |
32,331 |
30,140 |
20,989 |
18,824 |
11,342 |
11,315 |
||||||||
Current assets |
187,463 |
183,536 |
93,081 |
91,371 |
94,382 |
92,165 |
||||||||
Inventories |
46,742 |
45,745 |
41,898 |
41,302 |
4,844 |
4,443 |
||||||||
Financial services receivables |
58,615 |
54,216 |
−640 |
−510 |
59,255 |
54,726 |
||||||||
Other receivables and financial assets |
38,620 |
37,557 |
17,803 |
13,033 |
20,817 |
24,524 |
||||||||
Marketable securities |
16,769 |
17,080 |
13,546 |
13,376 |
3,223 |
3,703 |
||||||||
Cash, cash equivalents and time deposits |
25,923 |
28,938 |
19,679 |
24,169 |
6,243 |
4,769 |
||||||||
Assets held for sale |
795 |
– |
795 |
– |
– |
– |
||||||||
Total assets |
488,071 |
458,156 |
246,816 |
234,524 |
241,255 |
223,632 |
||||||||
|
|
|
|
|
|
|
||||||||
Equity and liabilities |
|
|
|
|
|
|
||||||||
Equity |
123,651 |
117,342 |
92,774 |
88,850 |
30,877 |
28,492 |
||||||||
Equity attributable to Volkswagen AG shareholders |
109,117 |
104,522 |
78,872 |
76,624 |
30,246 |
27,898 |
||||||||
Equity attributable to Volkswagen AG hybrid capital investors |
12,663 |
12,596 |
12,663 |
12,596 |
– |
– |
||||||||
Equity attributable to Volkswagen AG shareholders and hybrid capital investors |
121,781 |
117,117 |
91,535 |
89,219 |
30,246 |
27,898 |
||||||||
Noncontrolling interests |
1,870 |
225 |
1,239 |
−369 |
631 |
594 |
||||||||
Noncurrent liabilities |
196,497 |
172,846 |
90,822 |
77,692 |
105,675 |
95,154 |
||||||||
Financial liabilities |
113,556 |
101,126 |
17,592 |
14,187 |
95,965 |
86,939 |
||||||||
Provisions for pensions |
41,389 |
33,097 |
40,631 |
32,535 |
759 |
563 |
||||||||
Other liabilities |
41,551 |
38,623 |
32,600 |
30,970 |
8,951 |
7,652 |
||||||||
Current liabilities |
167,924 |
167,968 |
63,220 |
67,982 |
104,703 |
99,986 |
||||||||
Put options and compensation rights granted to noncontrolling interest shareholders |
– |
1,853 |
– |
1,853 |
– |
– |
||||||||
Financial liabilities |
87,912 |
89,757 |
−7,312 |
−1,504 |
95,224 |
91,261 |
||||||||
Trade payables |
22,745 |
23,607 |
19,603 |
20,962 |
3,142 |
2,645 |
||||||||
Other liabilities |
56,896 |
52,750 |
50,559 |
46,671 |
6,337 |
6,079 |
||||||||
Liabilities held for sale |
370 |
– |
370 |
– |
– |
– |
||||||||
Total equity and liabilities |
488,071 |
458,156 |
246,816 |
234,524 |
241,255 |
223,632 |
||||||||
On December 31, 2019, intangible assets in the Passenger Cars Business Area were higher than at the 2018 balance sheet date. The new IFRS 16 resulted in a marked rise in property, plant and equipment. Noncurrent assets rose by a total of €9.8 billion to €126.4 billion. Current assets increased by a total of €5.1 billion to €75.5 billion. Current other receivables and financial assets were above the prior-year figure. Total cash and cash equivalents and securities declined. The “Assets held for sale” item comprises the carrying amount expected to be derecognized for the shares in Autonomous Intelligent Driving. At the end of 2019, the Passenger Cars Business Area had total assets amounting to €201.8 (186.9) billion. The Passenger Cars Business Area’s equity rose to €75.8 (72.1) billion, mainly due to earnings-related factors. At €78.7 billion, noncurrent liabilities were 18.5% higher in total than on December 31, 2018. The noncurrent financial liabilities included in this item increased, mainly as a result of the application of the new IFRS 16. Pension provisions rose significantly, mainly due to the actuarial remeasurement following a change in the discount rate. Current liabilities declined by 2.1% in total. Current financial liabilities were higher than at the end of 2018. Current other liabilities were up on the figure as of December 31, 2018, primarily due to the effects from the measurement of derivatives and as a result of higher liabilities from buyback transactions.
| (XLS:)
|
PASSENGER CARS BUSINESS AREA BALANCE SHEET STRUCTURE1 |
||||||
|---|---|---|---|---|---|---|
€ million |
Dec. 31, 2019 |
Dec. 31, 2018 |
||||
|
||||||
|
|
|
||||
Noncurrent assets |
126,387 |
116,537 |
||||
Current assets |
75,459 |
70,408 |
||||
Total assets |
201,846 |
186,945 |
||||
Equity |
75,773 |
72,110 |
||||
Noncurrent liabilities |
78,679 |
66,406 |
||||
Current liabilities |
47,394 |
48,429 |
||||
Property, plant and equipment in the Commercial Vehicles Business Area increased year-on-year because of the application of the new IFRS 16. Noncurrent other receivables and financial assets decreased. In total, noncurrent assets amounted to €25.1 (24.1) billion and were thus higher than at the end of 2018. Current assets declined by €3.9 billion to €13.4 billion. Current other receivables and financial assets were down markedly because of the intragroup sale of the power engineering business. Total securities were markedly up on the prior-year figure, while cash and cash equivalents were lower. Total assets stood at €38.6 (41.5) billion at the end of 2019.
At €14.1 (13.8) billion, the Commercial Vehicles Business Area’s equity was slightly up on the previous year. The 7.9% rise in noncurrent liabilities compared with the end of 2018 was mainly attributable to higher liabilities from buyback transactions and an increase in pension provisions. Current liabilities declined by 23.8% in total. As a result of the extraordinary termination of the control and profit and loss transfer agreement with MAN SE, the “Put options and compensation rights granted to noncontrolling interest shareholders” item was settled: the tendered MAN shares were acquired, the cash compensation was paid and the remaining amount was reclassified directly to equity. Current other liabilities were down compared with the previous year’s balance sheet date.
| (XLS:)
|
COMMERCIAL VEHICLES BUSINESS AREA BALANCE SHEET STRUCTURE1 |
||||||
|---|---|---|---|---|---|---|
€ million |
Dec. 31, 2019 |
Dec. 31, 2018 |
||||
|
||||||
|
|
|
||||
Noncurrent assets |
25,143 |
24,117 |
||||
Current assets |
13,420 |
17,366 |
||||
Total assets |
38,563 |
41,483 |
||||
Equity |
14,115 |
13,788 |
||||
Noncurrent liabilities |
11,367 |
10,532 |
||||
Current liabilities |
13,081 |
17,162 |
||||
The Power Engineering Business Area’s intangible assets and property, plant and equipment were lower than the respective prior-year figures. Noncurrent assets decreased in total. Current assets rose 16.8% compared with December 31, 2018. The “Assets held for sale” item included in current assets mainly comprises the asset carrying amount expected to be derecognized following the planned disposal of Renk. Total assets in the Power Engineering Business Area stood at €6.4 (6.1) billion at the end of 2019.
On December 31, 2019, the Power Engineering Business Area’s equity amounted to €2.9 (3.0) billion. Noncurrent liabilities were at the prior-year level. Noncurrent financial liabilities increased, while other noncurrent liabilities declined. Overall, current liabilities were higher than a year earlier. Contributing factors were a rise in current financial liabilities and in liabilities held for sale, which include the carrying amount of the liabilities of Renk expected to be derecognized.
Financial Services Division balance sheet structure
At the end of 2019, the Financial Services Division had total assets of €241.3 billion, 7.9% more than on December 31, 2018.
Noncurrent assets were up by 11.7% in total. The property, plant and equipment included in this item decreased. Investment property and lease assets rose due to business growth and as a result of the application of the new IFRS 16, while other receivables and financial assets declined by a corresponding amount. Noncurrent financial services receivables rose, driven by higher volumes.
Current assets amounted to €94.4 (92.2) billion. While current financial services receivables increased, current other receivables and financial assets declined. As of December 31, 2019, cash and cash equivalents in the Financial Services Division stood at €6.2 billion, up €1.5 billion on the prior-year figure.
The Financial Services Division accounted for around 49.4 (48.8)% of the Volkswagen Group’s assets at the balance sheet date.
At €30.9 billion, the Financial Services Division’s equity was 8.4% higher than the figure at the previous balance sheet date, driven mainly by healthy earnings. The equity ratio was 12.8 (12.7)%.
Noncurrent liabilities were up by 11.1% at the end of 2019, mainly because of a rise in noncurrent financial liabilities to refinance the business volume. Overall, current liabilities were higher than a year earlier. Especially the current financial liabilities included in this item recorded an increase.
Deposits from the direct banking business totaled €32.5 (29.9) billion, thus exceeding the figure recorded as of December 31, 2018.
| (XLS:)
|
POWER ENGINEERING BUSINESS AREA BALANCE SHEET STRUCTURE |
||||
|---|---|---|---|---|
€ million |
Dec. 31, 2019 |
Dec. 31, 2018 |
||
|
|
|
||
Noncurrent assets |
2,206 |
2,499 |
||
Current assets |
4,202 |
3,597 |
||
Total assets |
6,408 |
6,097 |
||
Equity |
2,885 |
2,953 |
||
Noncurrent liabilities |
777 |
754 |
||
Current liabilities |
2,746 |
2,391 |
||